
Investors
We are focused on maximising stakeholder value by seeking opportunities for growth, operating efficiently, ensuring disciplined capital allocation and pursuing sustainability endeavours.


Financial Results Centre
View our latest financial results.
Annual reporting
Explore a comprehensive overview of our financial performance, sustainability initiatives and outlook

Shareholder information
Dividend information
The Group aims to maintain a headline earnings per share cover ratio of between 1.5 – 2.5. The dividend is declared and paid out in Rand for the holders of ordinary shares. Details on recent dividends paid/payable are included below.
| Dividend history | Date paid/payable | Cents per share |
|---|---|---|
| FY25 Final Dividend | 18-Aug-2025 | 400 |
| FY25 Special Dividend | 18-Aug-2025 | 275 |
| FY24 Final Dividend | 19-Aug-2024 | 375 |
| FY24 Special Dividend | 19-Aug-2024 | 325 |
| FY23 Final Dividend | 14-Aug-23 | 375 |
| FY22 Final Dividend | 1-Aug-22 | 275 |
| FY22 Final Dividend | 1-Aug-22 | 525 |
| FY21 Final Dividend | 16-Aug-21 | 200 |
| FY21 Final Dividend | 16-Aug-21 | 400 |
| FY20 Final Dividend | - | - |
| FY19 Final Dividend | - | - |
| FY18 Final Dividend | Jul-18 | 180 |
| FY18 Interim Dividend | Jul-18 | 200 |
| FY17 Final Dividend | 17-Jul-17 | 180 |
| FY17 Interim Dividend | 17-Jul-17 | 160 |
| FY16 Final Dividend | 25-Jul-16 | 180 |
| FY16 Interim Dividend | 25-Jul-16 | 180 |
| FY15 Final Dividend | 20-Jul-15 | 300 |
| FY15 Interim Dividend | 20-Jul-15 | 190 |
Charters
Shareholder services
Registered office and postal address:
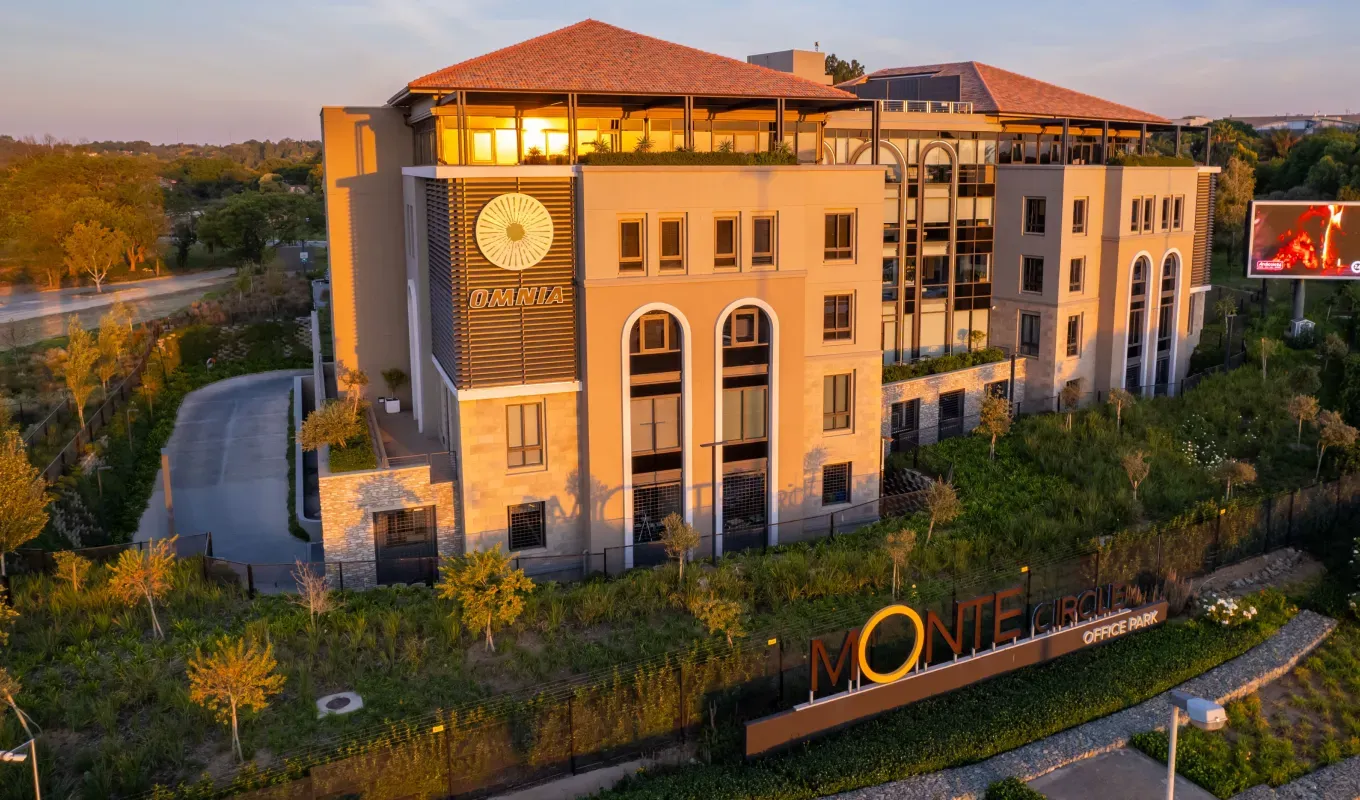
Omnia House
Building H
Monte Circle Office Park
178 Montecasino Boulevard
Fourways
2191
P.O. Box 69888
Bryanston
2021
Gauteng
South Africa
Omnia Holdings Limited (a company registered and domiciled in the Republic of South Africa), Registration number: 1967/003680/06, JSE code: OMN ISIN: ZAE000005153
Transfer Secretaries
JSE Investor services South Africa Proprietary Limited, 13th floor, Rennie House, 19 Ameshoff Street, Braamfontein
Sponsor
Java Capital, 6th Floor, 1 Park lane, Wierda Valley, Sandton, 2196P.O. Box 522606, Saxonwold, 2132.
Auditors
Deloitte & Touche, 5 Magwa Crescent, Waterfall City, Waterfall, 2090Private Bag X6, Gallo Manor, 2052